Nasdaq 100 slumps to recent lows
Wednesday’s gains were wiped out in a dramatic reversal on Thursday, which took the index right back to the lows of the week around 18,600.
If 18,600 is broken the lows from the end of May at 18,187 are the next level to watch. While the overall uptrend is still intact, the price is now below the 100-day simple moving average (SMA), having closed below this for the first time since 1 May.
Nasdaq 100 Daily Chart
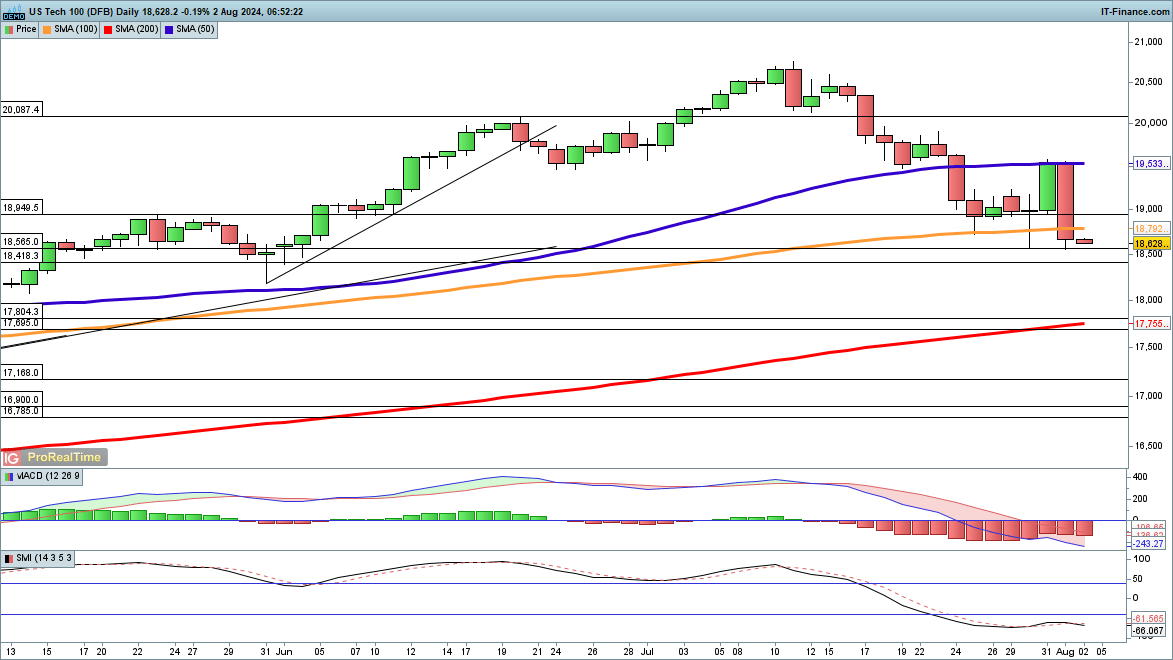
Source: IG, ProRealTime
Dow back to trendline support
The index has returned to trendline support from the June lows, reversing the gains made over the past week.
A close below trendline support and below the May high then opens the way to 39,587. Below this lie the 50- and 100-day SMAs, not tested since early July.
Dow Daily Chart
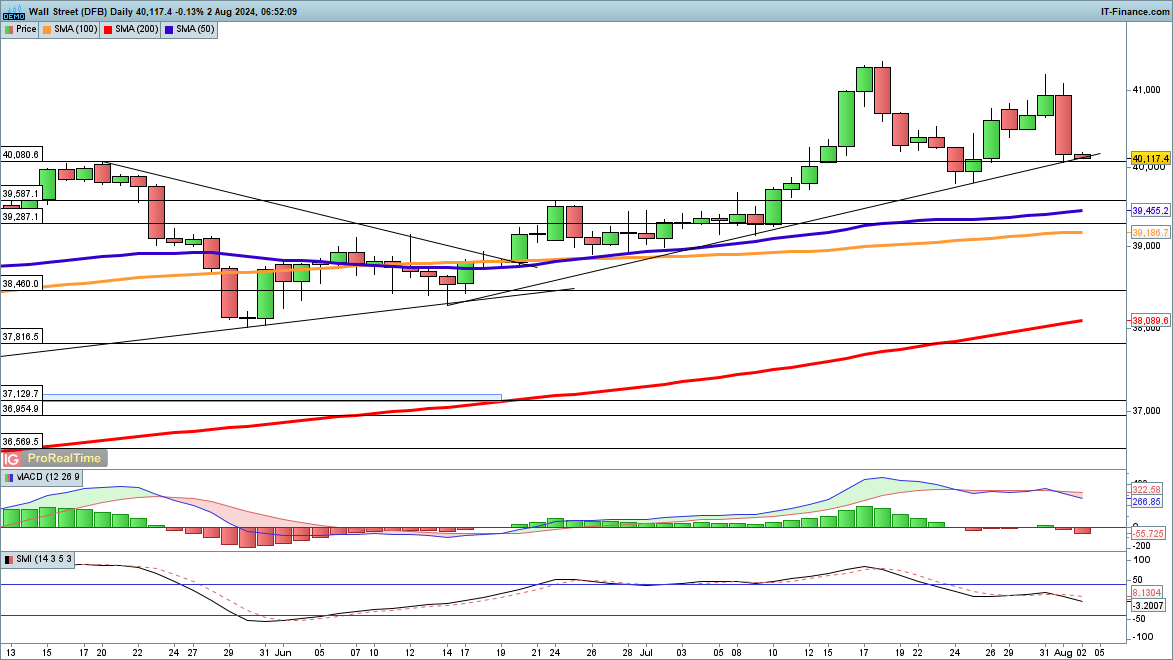
Source: IG, ProRealTime
Recommended by Chris Beauchamp
Get Your Free Equities Forecast
DAX at three-month low
Thursday’s drop has wiped out all the gains made since early June.
The index now sits at its lowest level since the beginning of May. A close below 17,790 would leave the price on course to test the 200-day SMA, and then the 19 April low at 17,400.
DAX Daily Chart
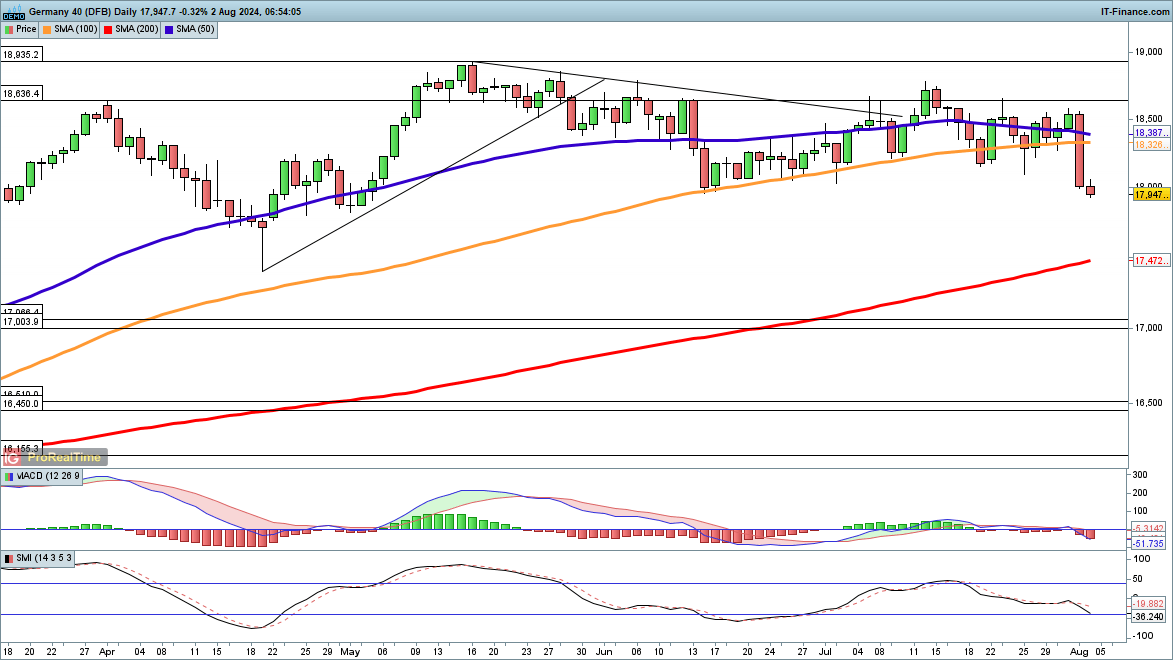
Source: IG, ProRealTime