Major Indices Talking Points
- FTSE 100 takes a hit as UK inflation drops less than expected
- DAX consolidates in low volatility sideways range
- S&P 500 trades close to Tuesday’s record high
- Discover the fundamental and technical considerations to keep in mind for indices in Q2
Recommended by Axel Rudolph
Get Your Free Equities Forecast
FTSE 100 takes a hit as UK inflation drops less than expected
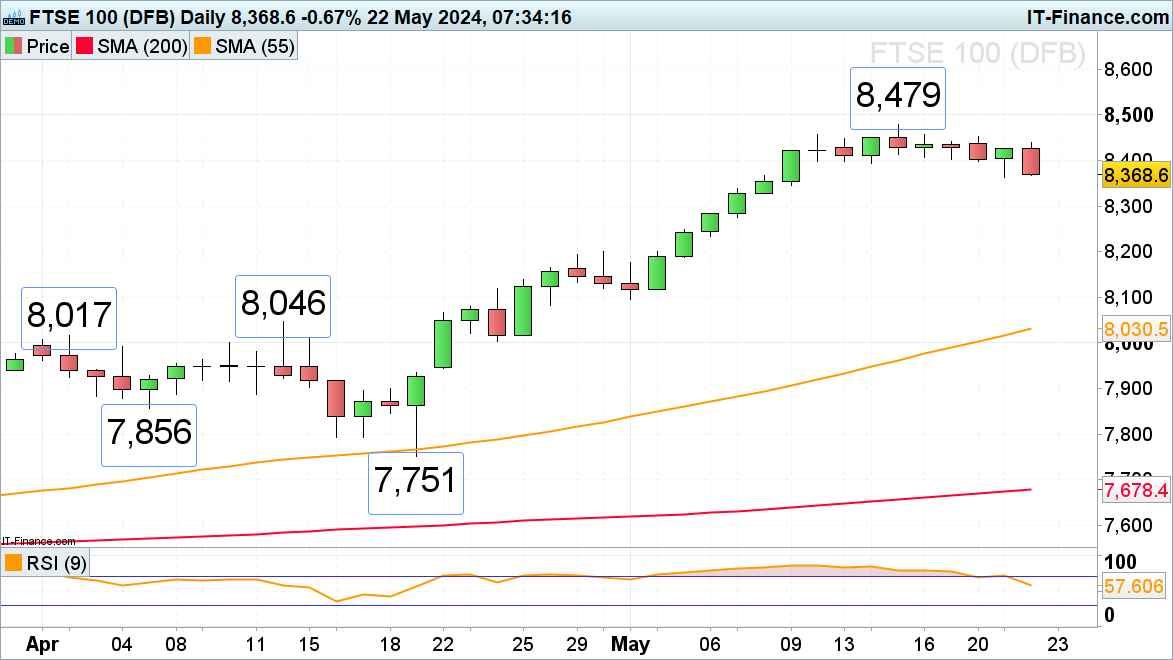
The FTSE 100 sold off in pre-market trading and opened lower following higher-than-expected UK April CPI growth which slowed to 0.3% MoM and 2.3% YoY (from 0.6% and 3.2%), but above expectations of 0.2% and 2.1%.
Only a fall through Tuesday’s low at 8,363 would lead to further downside being seen, though, with the 8,300 region being back in sight in this scenario.
While this week’s low at 8,363 holds, further sideways trading below last week’s record high at 8,479 remains on the cards. Above it lies the psychological 8,500 mark.
FTSE 100 Daily Chart
Source: IG, ProRealTime, prepared by Axel Rudolph
DAX 40 consolidates in low volatility sideways trading range
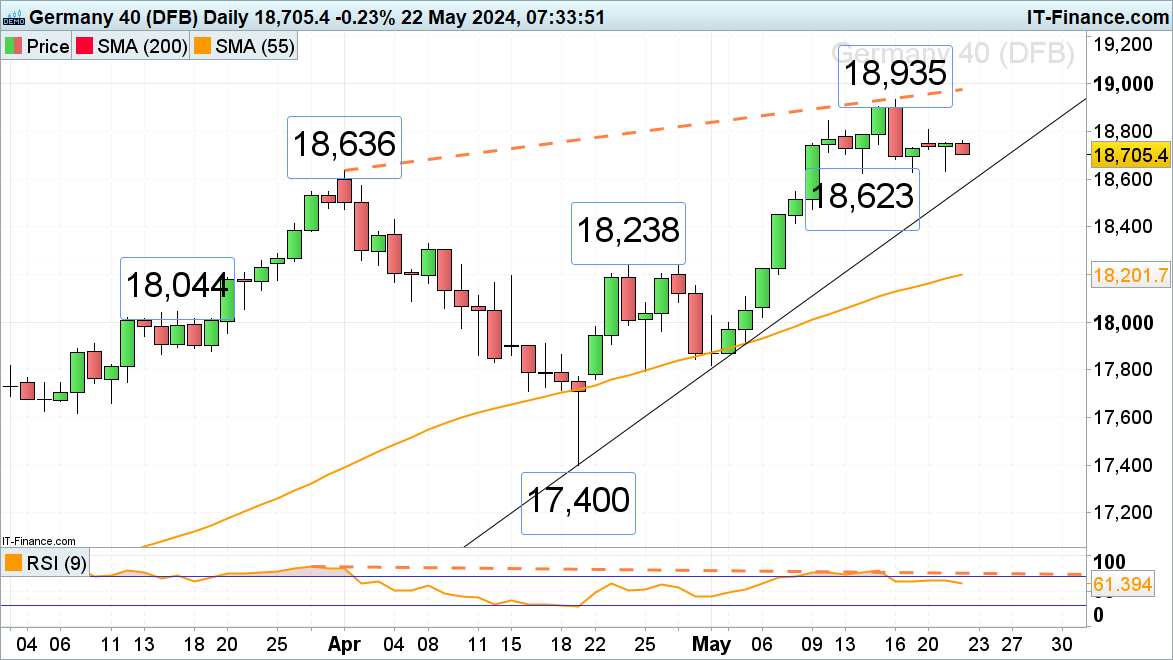
The DAX 40 continues to range trade above its mid-May 18,623 trough in low volatility ahead of European HCOB flash manufacturing and services PMIs out on Thursday. A drop through this level would have negative implications with the April-to-May uptrend line at 18,562 being eyed.
While 18,623 holds, though, further range trading is at hand while Monday’s high at 18,808 caps.
Since last week’s record high hasn’t been accompanied by a higher reading of the daily Relative Strength Index (RSI), negative divergence can be spotted on the daily candlestick chart.
DAX Daily Chart
Source: IG, ProRealTime, prepared by Axel Rudolph
S&P 500 trades close to Tuesday’s record high
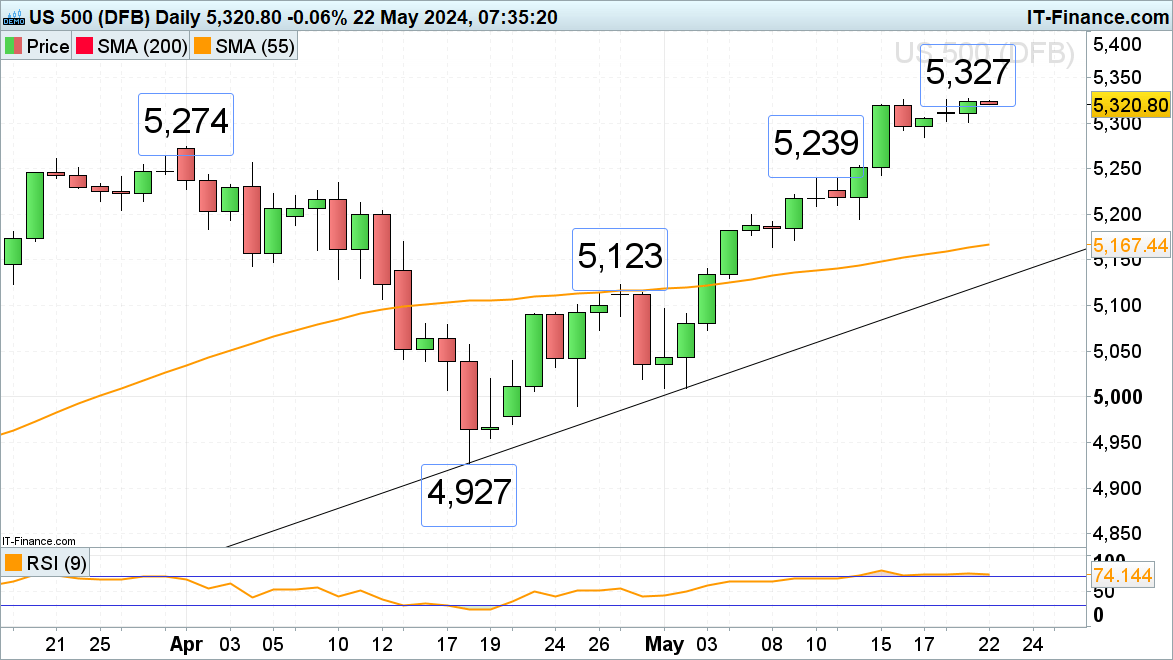
The S&P 500’s rally from its early May low has taken it to Tuesday’s record high at 5,327, near which it is trading despite more Fed talk pointing towards a ‘rates higher for longer’ scenario ahead of Nvidia earnings and FOMC minutes which could become a catalyst for the next directional move.
Immediate upside pressure should remain in play while Tuesday’s low at 5,301 underpins on a daily chart closing basis. If fallen through, the previous record high made in April at 5,274 may act as support.
Were a new all-time high to be made, though, the 5,350 region would be in focus.
S&P 500 Daily Chart
Source: IG, ProRealTime, prepared by Axel Rudolph
If you’re puzzled by trading losses, why not take a step in the right direction? Download our guide, “Traits of Successful Traders,” and gain valuable insights to steer clear of common pitfalls that can lead to costly errors.
Recommended by Axel Rudolph
Traits of Successful Traders


