Major Indices Roundup:
- FTSE consolidates below record highs ahead of the weekend
- DAX comes off record high on hints of negative divergence
- S&P 500 steps down from May record high
Recommended by Axel Rudolph
The Fundamentals of Trend Trading
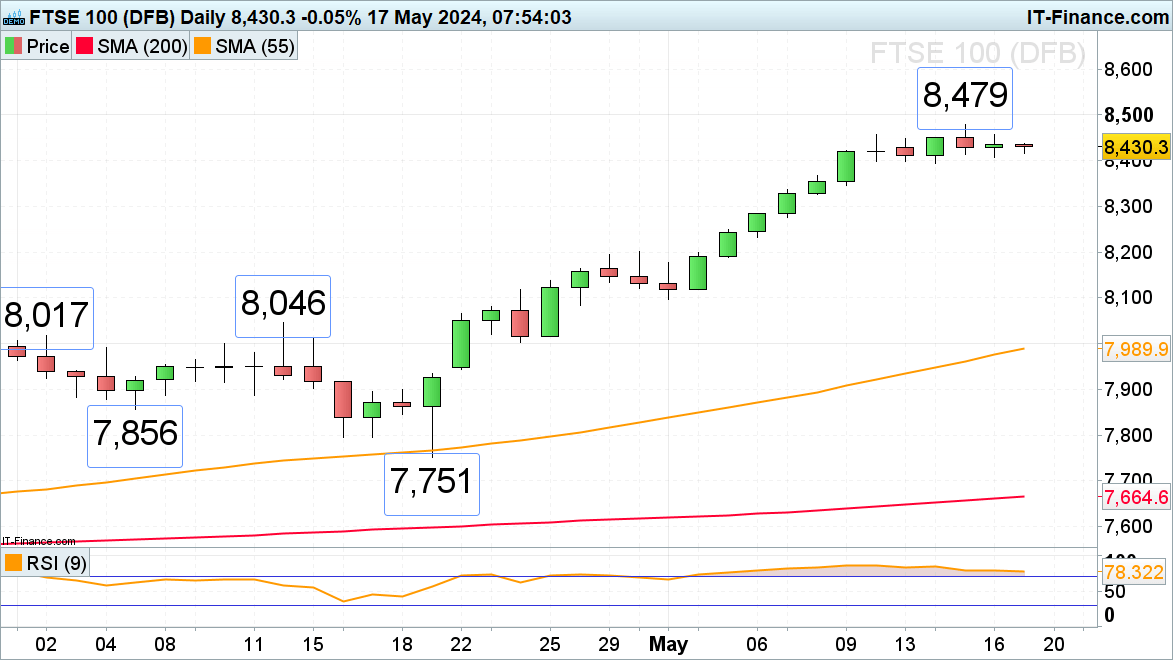
FTSE 100 consolidates below record highs
On Thursday the FTSE 100 remained below this week’s record high as gains for HSBC were countered by losses for Shell, while further down the weightings BT’s 15% gain, adding 4 points to the index, was neatly countered by Sage’s sharp drop.
Upside pressure will be maintained while Tuesday’s low at 8,393 underpins on a daily chart closing basis. A rise above the current record high at 8,479 would engage the 5,000 mark.
FTSE 100 Daily Chart
Source: ProRealTime, prepared by Axel Rudolph
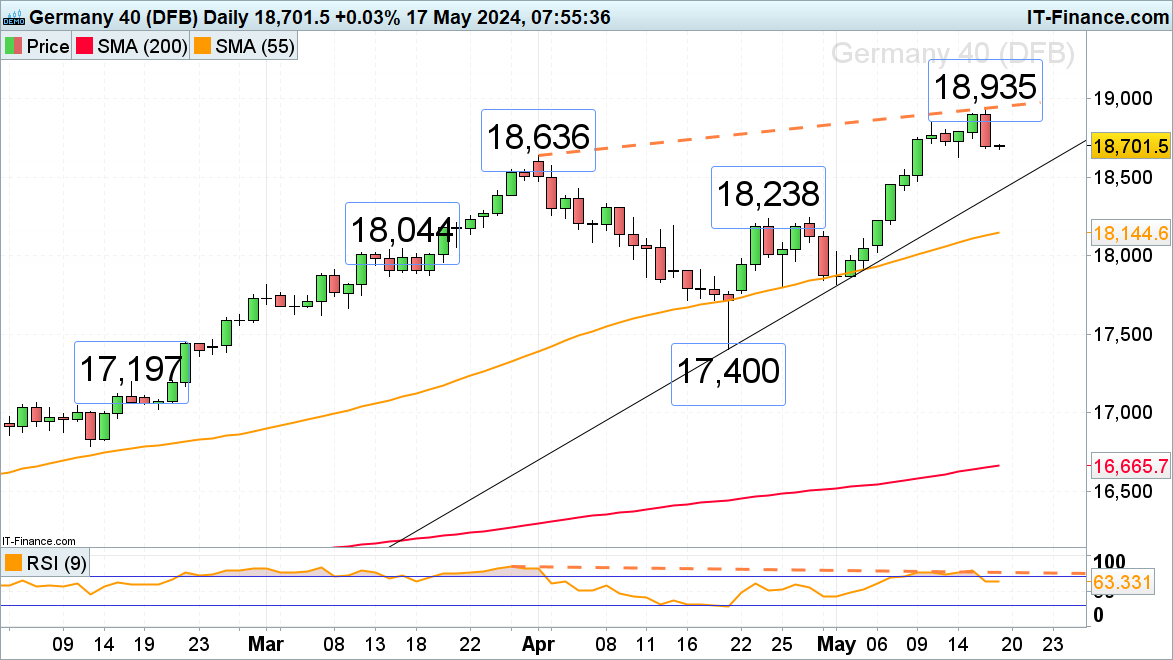
DAX 40 comes off record high
On Thursday the DAX 40 made a record high close to the minor psychological 19,000 mark before falling and forming a bearish engulfing pattern on the daily candlestick chart. This increases the likelihood of at least a short-term bearish reversal being seen over the coming days.
Since this week’s high hasn’t been accompanied by a higher reading of the daily Relative Strength Index (RSI), negative divergence can also be seen which may lead to a several hundred points sell-off taking the index back to its April-to-May uptrend line at 18,410. For this scenario to become more probable a fall through this week’s low at 18,623 would need to occur, though.
DAX Daily Chart
Source: ProRealTime, prepared by Axel Rudolph
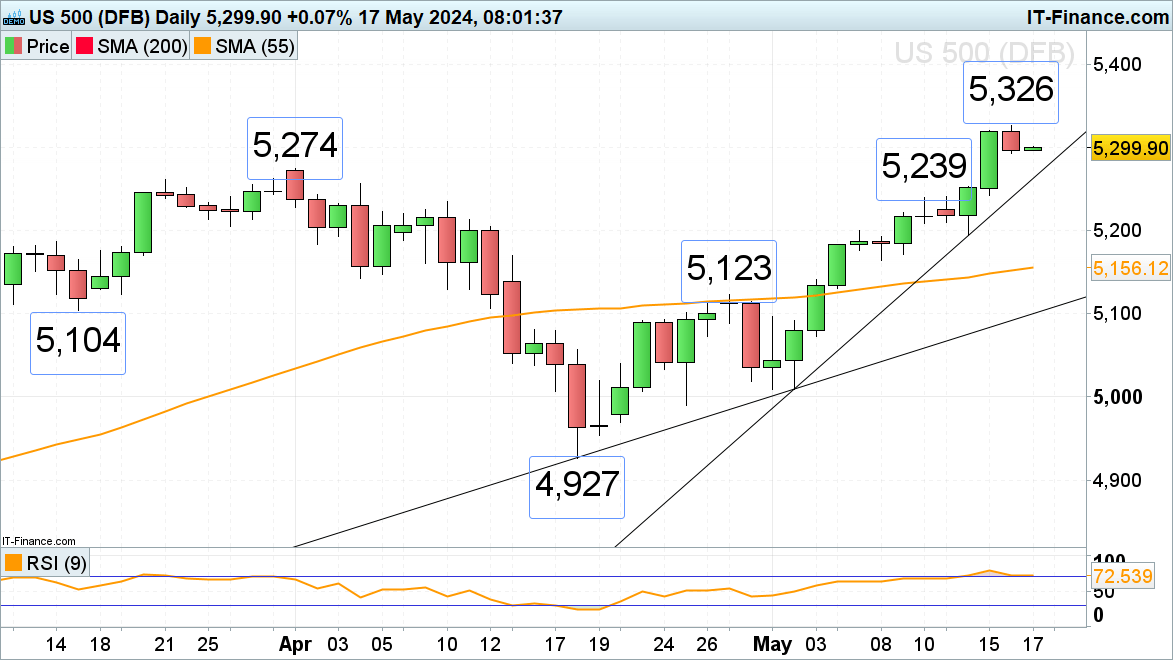
S&P 500 is coming off its May record high
The S&P 500’s rally from its early May low has taken it to Thursday’s record high at 5,326 before pausing amid Fed comments making it clear that the battle against inflation hasn’t as yet been won.
The previous record high made in April at 5,274 may thus be revisited on a fall through Thursday’s 5,293 low with the accelerated uptrend line at 5,262 representing another potential downside target.
Were a new all-time high to be made, though, the 5,350 region would be in focus.
S&P 500 Daily Chart
Source: ProRealTime, prepared by Axel Rudolph
Find out why trader positioning is so important and discover how to avoid a commonly observed mistake in trending markets:
| Change in | Longs | Shorts | OI |
| Daily | 0% | 0% | 0% |
| Weekly | -1% | -3% | -2% |


