AUD, CAD Technical Analysis
- US non-farm payrolls surprise to the upside, along with average earnings
- USD/CAD eyes a test of the May high as the dollar spikes higher
- AUD/USD heads sharply lower after massive US NFP surprise
- The analysis in this article makes use of chart patterns and key support and resistance levels. For more information visit our comprehensive education library
Recommended by Richard Snow
Recommended by Richard Snow
Master The Three Market Conditions
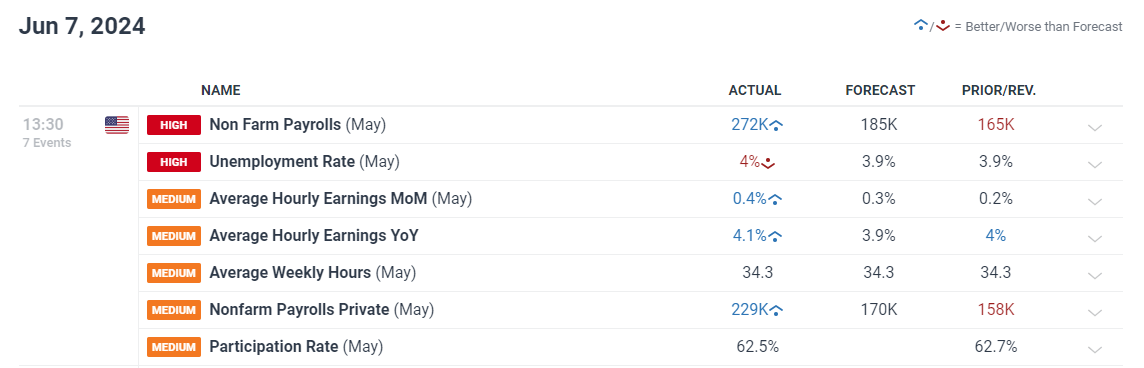
US Non-Farm Payrolls and Average Earnings for May Surprise to the Upside
Non-farm payroll data for May provided a massive beat compared to estimates – surpassing even the most optimistic of estimates in a poll provided by Reuters. Not only that, but average earnings compared to May 2023 rose to 4.1%, higher than the prior reading of 4% and the data point rose higher than the highest single forecast across the distribution of estimates.
Customize and filter live economic data via our DailyFX economic calendar
USD/CAD Eyes a Test of the May High as the Dollar Spikes Higher
USD/CAD has hinted at a bullish breakout for some time but has lacked a specific catalyst to get back up the to May swing high (1.3743) again. It would appear that NFP has provided the reason to not only test the level but actually trade above the previous ceiling at the time of writing.
Canada also released its job stats and while they were positive, the additional jobs created were nowhere near the magnitude of those in the US. Therefore, after the Bank of Canada (BoC) cut interest rates earlier this week, USD/CAD naturally surfaces as one to watch – particularly as Canadian inflation continues to moderate towards that 2% target.
The swing high remains the market to close above this week the late April high of 1.3785 the next level of interest to the upside, followed by the yearly swing high at 1.3846. The RSI has some way to go before this pair runs the risk of overheating, which bodes well for USD/CAD bulls. Should the NFP effect prove short-lived, we will likely see a pullback at the start of next week but US data continues to dominate next week with the CPI print and FOMC decision due – meaning there will be plenty of variables to consider.
USD/CAD Daily Chart
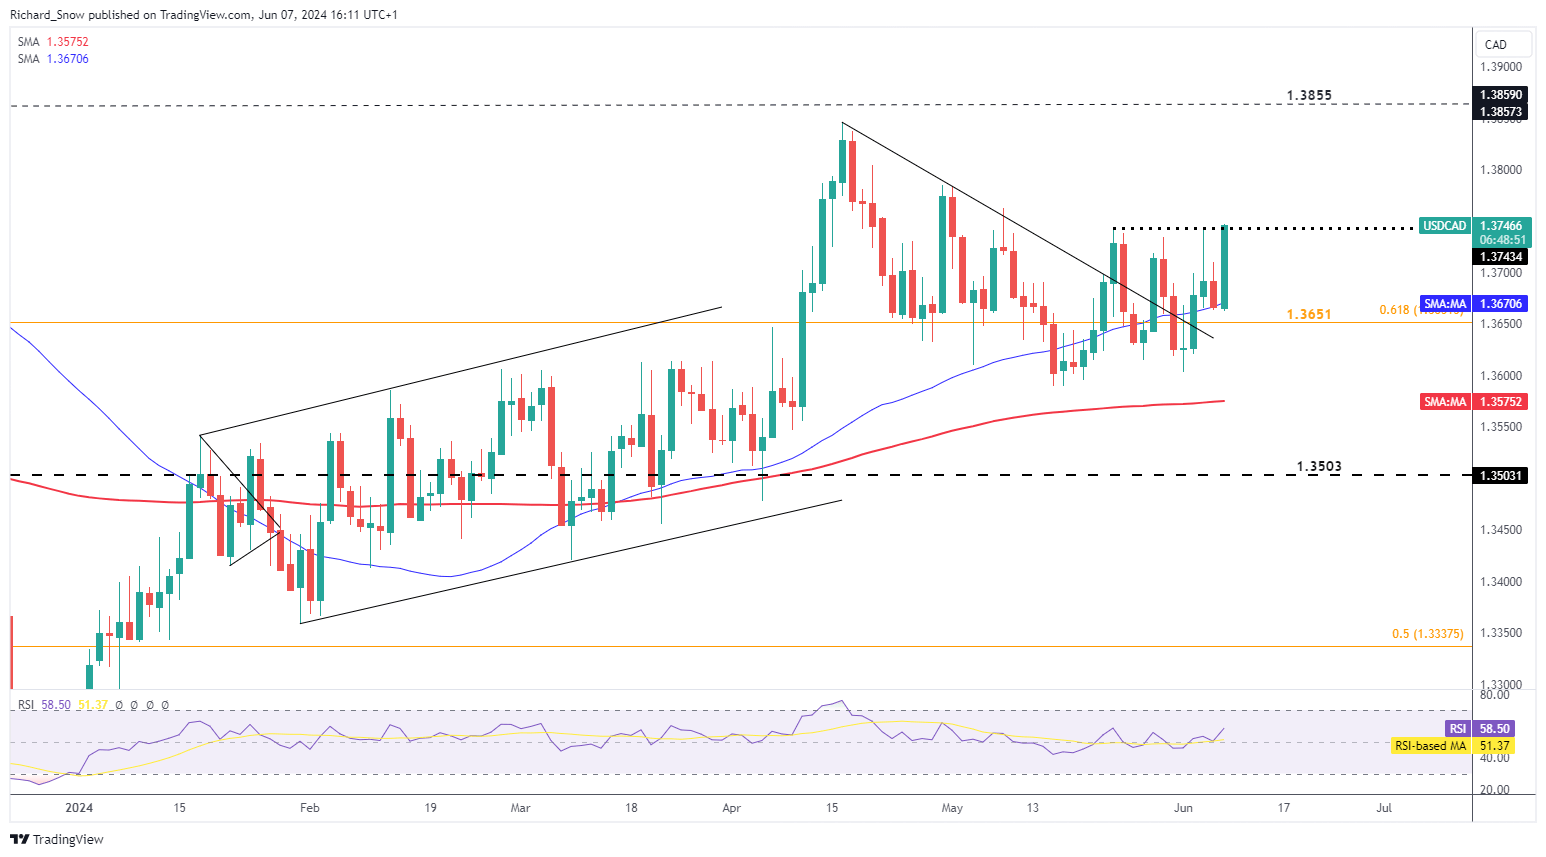
Source: TradingView, prepared by Richard Snow
AUD/USD Pulls Back Sharply, Respecting the Pre-Pandemic Low
AUD/USD revealed a sharp pullback on Friday after NFP data surprised the market. AUD/USD had consolidated a little beneath the recent May swing high of 0.6714, hovering around the pre-pandemic low of 0.6680.
The pair has declined 100 pips on the day (daily high to daily low) and currently tests the 0.6580 level which has provided a pivot point in March and April last year an on occasion in 2024 as well. Dynamic support appears at the blue 50-day simple moving average (SMA), followed by the red 200 SMA at 0.6538. Resistance appears at 0.6644 – a level that kept buyers at bay in Mach and April.
AUD/USD Daily Chart
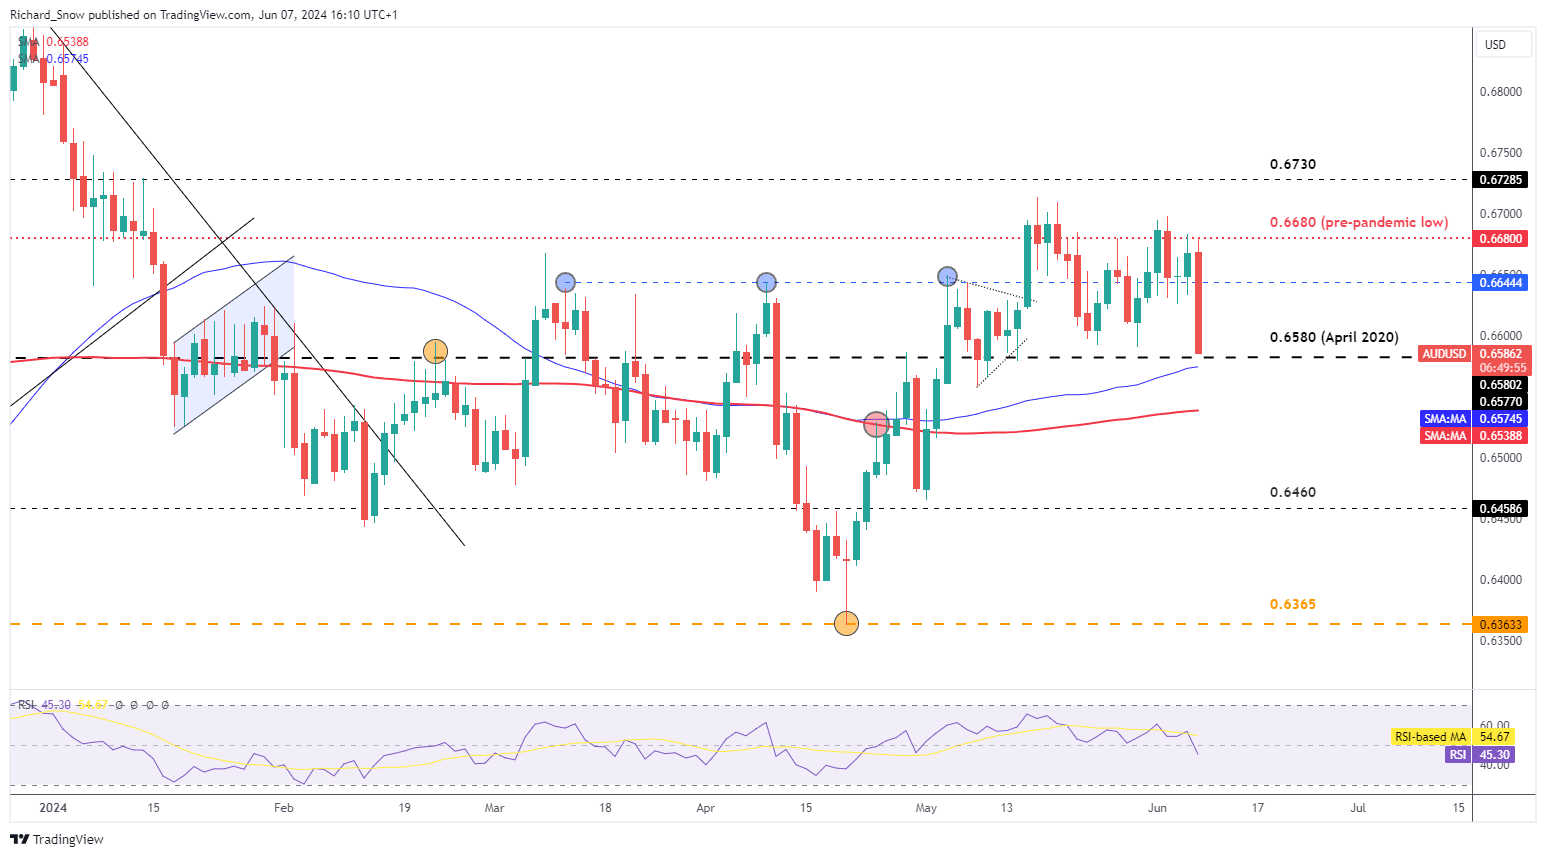
Source: TradingView, prepared by Richard Snow
Discover the power of crowd mentality. Download our free sentiment guide to decipher how shifts in AUD/USD’s positioning can act as key indicators for upcoming price movements.
| Change in | Longs | Shorts | OI |
| Daily | 6% | -15% | -3% |
| Weekly | 16% | -28% | -5% |
— Written by Richard Snow for DailyFX.com
Contact and follow Richard on Twitter: @RichardSnowFX