FTSE 100 breakout continues
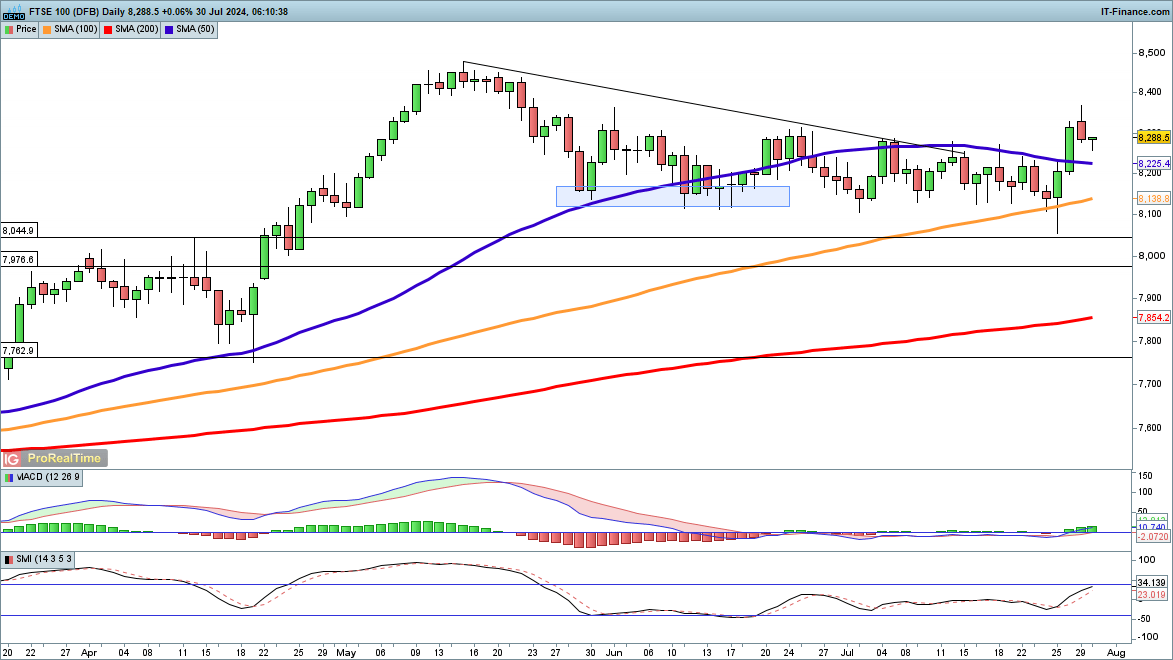
The end of last week saw the index stage an impressive breakout from the range that had dominated since the end of May. The price smashed through the 50-day simple moving average (SMA), and rallied to a two-month high, having hit a three-month low on Thursday.
While it stalled yesterday, it has begun to move higher again, and seems on course to move back to the May highs. A close back below 8200 would be needed to negate this view.
FTSE 100 Daily Chart
| Change in | Longs | Shorts | OI |
| Daily | 11% | -11% | -5% |
| Weekly | -45% | 34% | -9% |
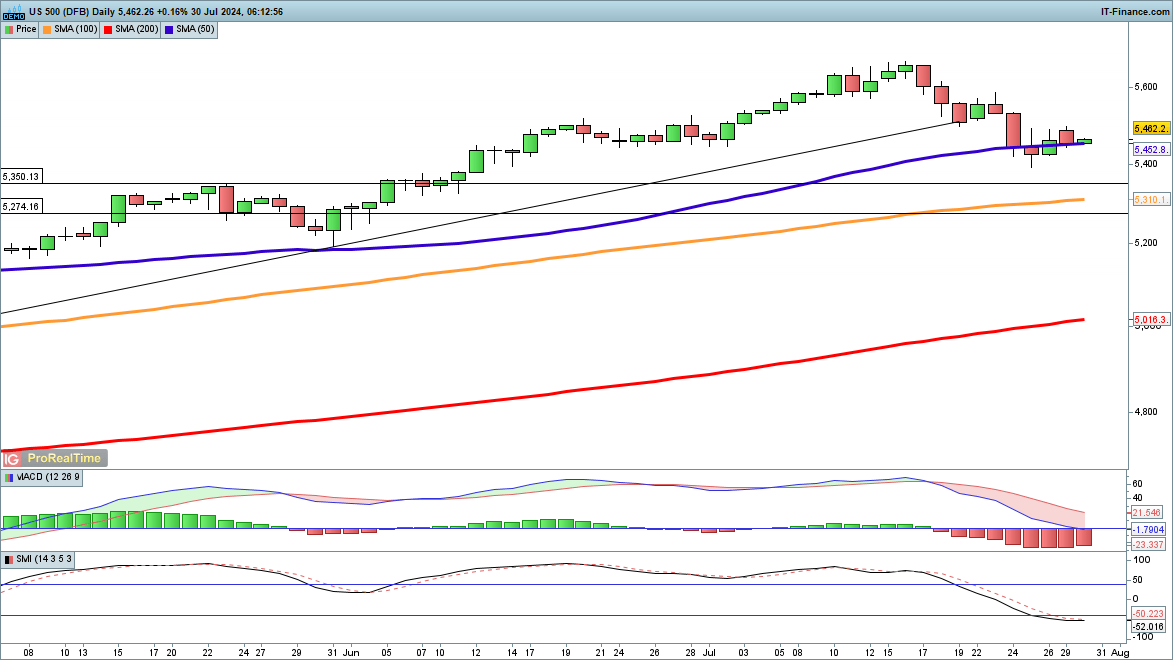
S&P 500 forms higher low
The index continues to form a low, having rallied back above the 50-day SMA after falling to 5400 last week.A close above 5500 would help to cement the bullish view and put the index back on a trajectory to hit the July highs. Despite the excitement around the recent volatility, this looks like a normal pullback.
A reversal back below 5400 is needed to put the sellers back in charge.
S&P500 Daily Chart
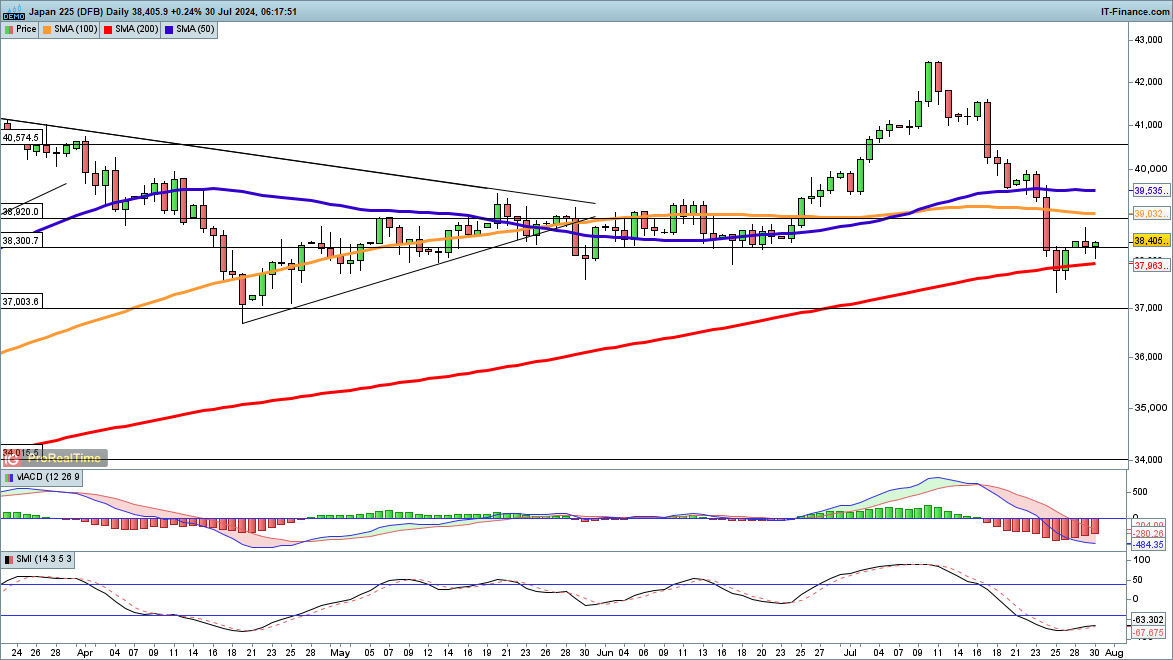
Nikkei 225 moves higher
The Nikkei’s huge drop has been halted for now, after it briefly moved below the 200-day SMA last week.While it was little changed on Monday, it has made more gains overnight and has moved back above the 38,300 level that marked support in June. Further gains target the 100- and then 50-day SMAs, and then the 40,000 level.
Sellers will want a close back below the 200-day SMA, and then a fresh move below 37,500, to open the way to more downside.
Nikkei 225 Daily Chart
Recommended by Chris Beauchamp
Get Your Free Equities Forecast