FTSE 100 in recovery mode
The index continues to recover from its low on Monday, rallying back above 8000 yesterday and moving higher in early trading.
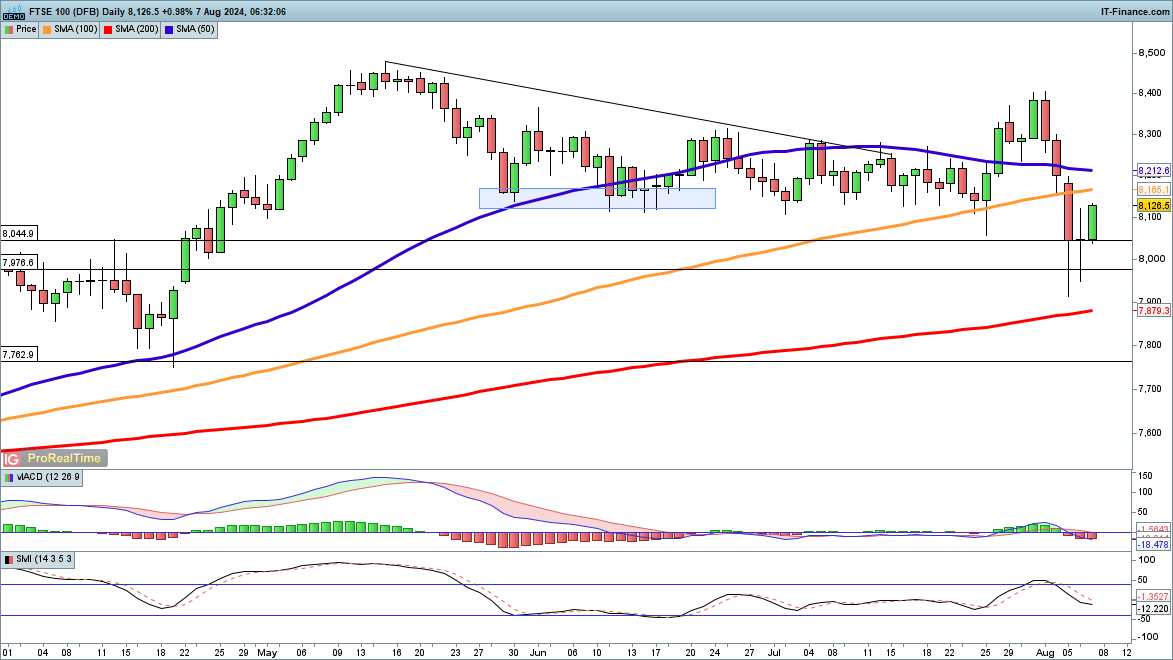
Further gains target the August high at 8400, and then on to the record high from May just below 8500. A close above the June and July support level of around 8140 bolsters the bullish view, while a reversal back below 8040 would negate this view for now.
FTSE 100 Daily Chart
| Change in | Longs | Shorts | OI |
| Daily | -17% | 21% | -2% |
| Weekly | 90% | -45% | -15% |
S&P 500 struggles to push higher
A more modest bounce has been seen here over the last few days, with the price rebounding off the lows but struggling to make further progress.
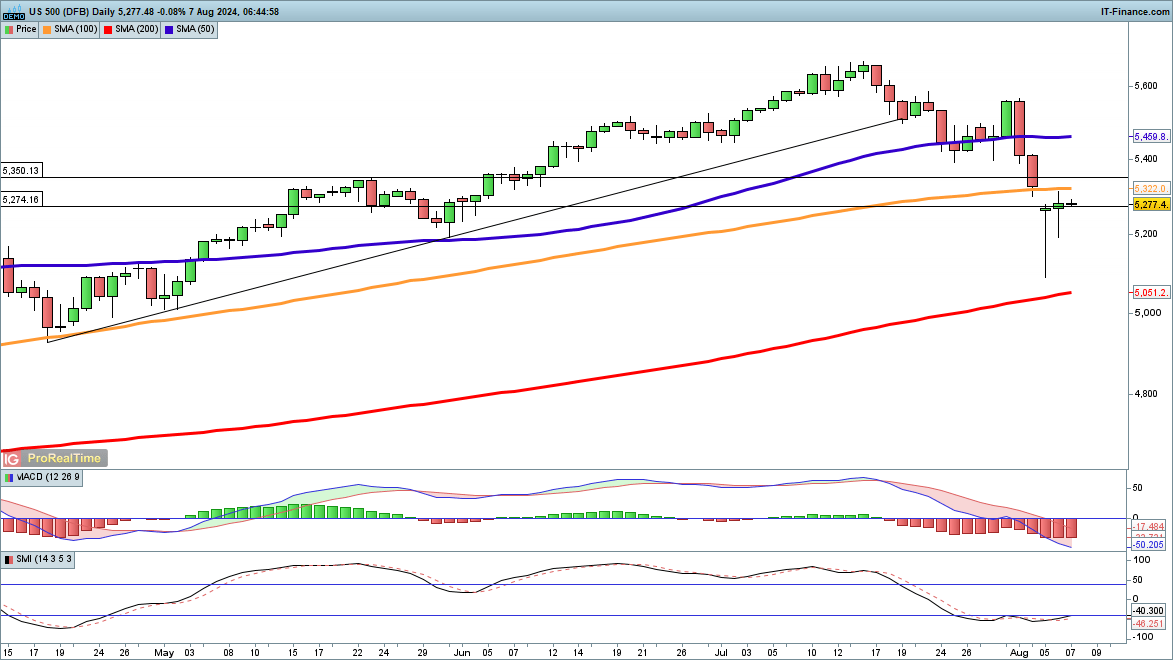
A close above 5300 would help to support a bullish view and provide further indications that a low has been formed. Sellers will be watching for a move back below 5200, indicating that a new move lower towards 5100 could be at hand.
S&P 500 Daily Chart
Nikkei 225 rebounds above 35,000
The index has rallied once more, after an indecisive session on Tuesday.
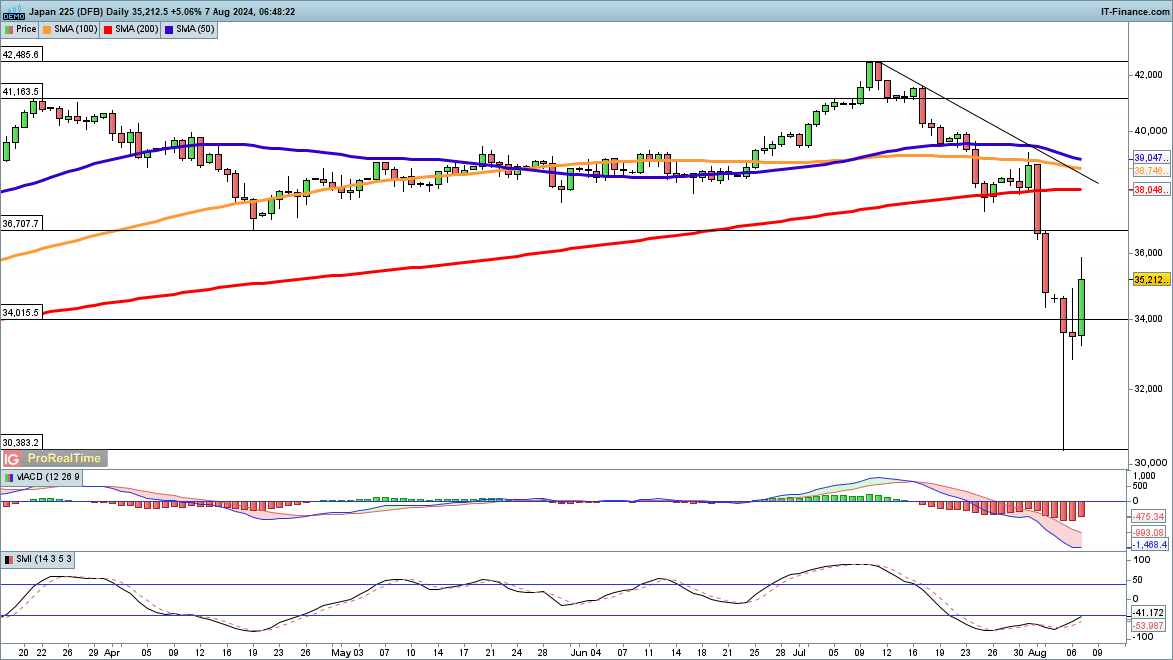
While it remains heavily oversold, it has moved back above 35,000. Further gains target the April low at 36,707 and the late May low at 37,660. A turn lower below 37,000 risks the creation of a lower high and renewed bearish momentum.
Nikkei 225 Daily Chart
Recommended by Chris Beauchamp
Building Confidence in Trading