FTSE 100 moves higher
The index closed above the 50-day SMA once more yesterday, as it claws back the losses of late July and early August.
The bounce from the 8000 level is intact, and further gains target the 8300 area and then the 31 July/1 August high at 8400. Sellers will want a reversal below 8100 to signal the possibility of a new leg lower.
FTSE 100 Daily Chart
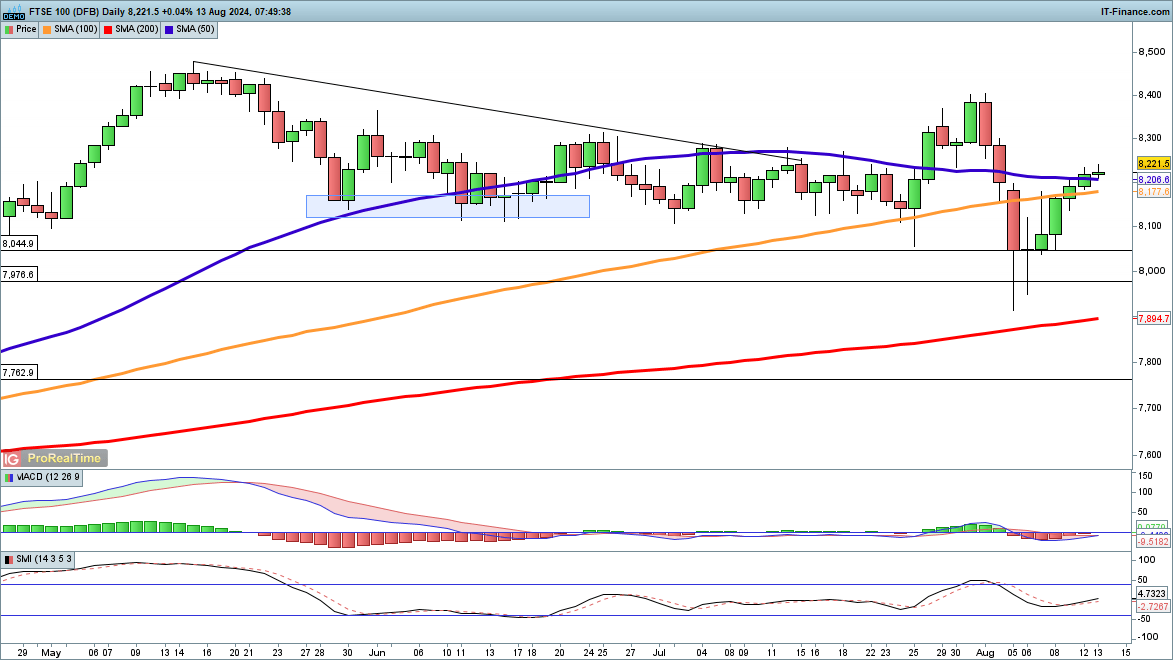
Source: ProRealTime, by Christopher Beauchamp
S&P 500 rallies above 5300
Steady gains over the past three sessions have taken the price back above 5300 and above the May high. Further gains now look to the 50-day SMA and then the late July high at 5570.
So far there is no sign of a reversal, though a close back below 5300 would raise concerns that a new downturn had begun.
S&P 500 Daily Chart
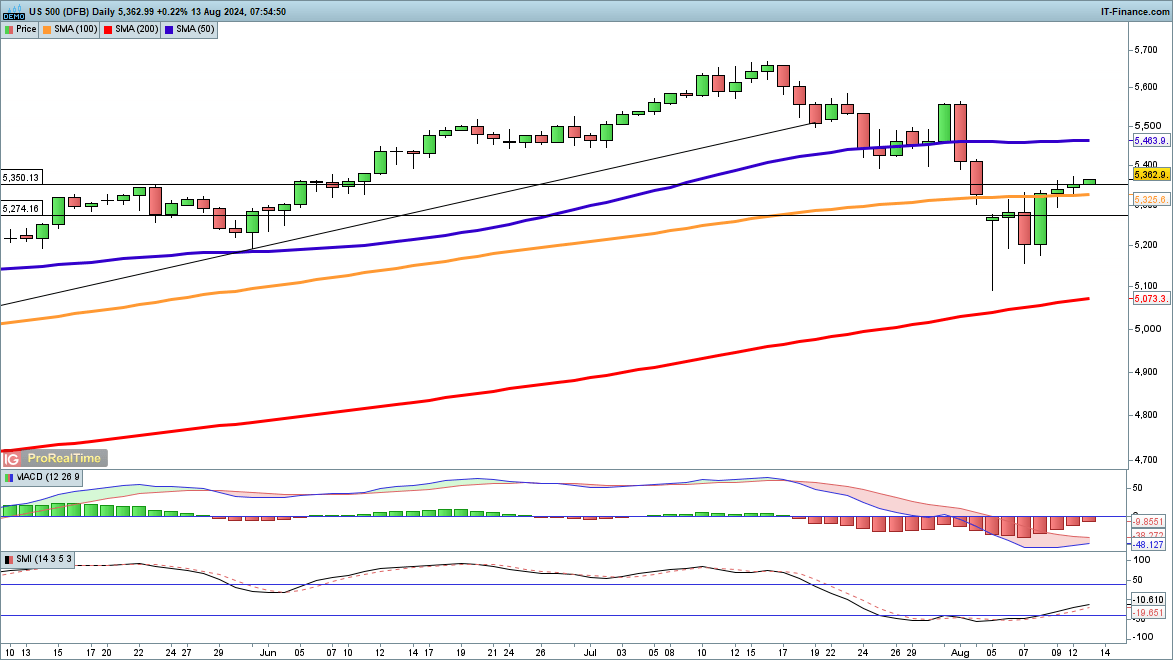
Source: ProRealTime, by Christopher Beauchamp
Recommended by Chris Beauchamp
Get Your Free Equities Forecast
Nikkei 225 makes further headway
Yet more gains here for the index mean that the 36,707 level becomes the next one to watch, having marked a peak in January and then forming support in April.
For the moment the buyers remain in charge. A turn lower back below 35,000 might signal that a fresh downward move was underway.
Nikkei Daily Chart
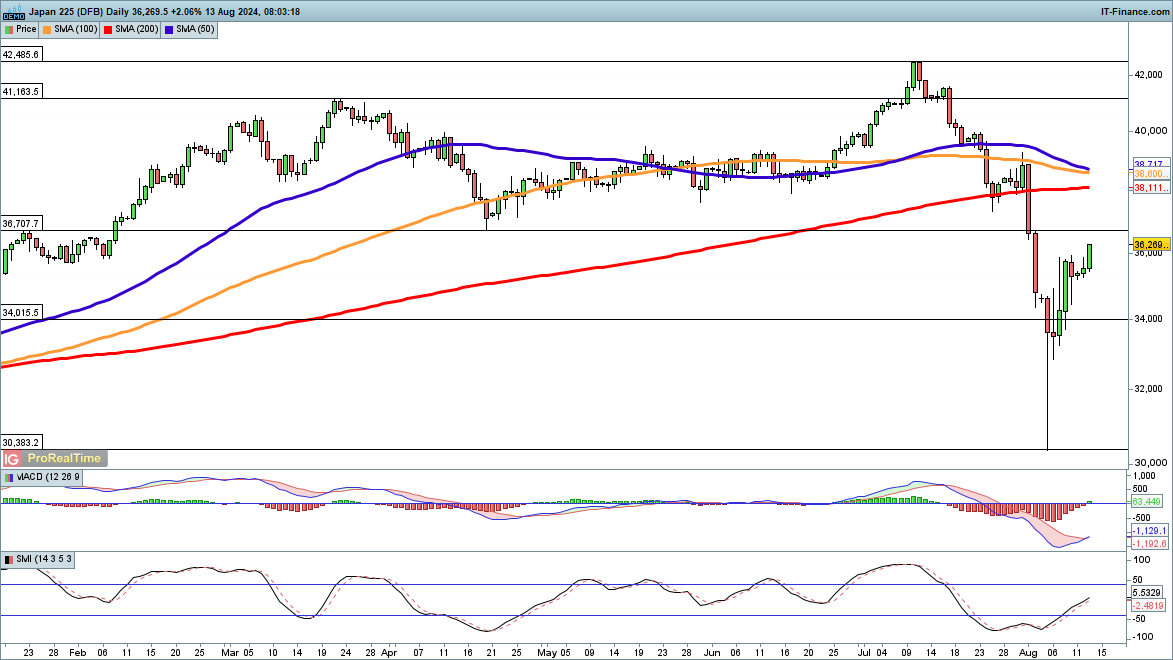
Source: ProRealTime, by Christopher Beauchamp