The Indian Rupee (INR) opens lower against the US Dollar (USD) at the start of the week. The USD/INR pair rises to near 90.70 as the Indian Rupee has come under pressure following a sharp sell-off by overseas investors in the Indian stock market on Friday, resulting in a significant outflow of foreign funds.
On Friday, Foreign Institutional Investors (FIIs) sold shares worth Rs. 7,395.41 crore in the Indian equity market, according to data from the National Stock Exchange (NSE), as fears of Artificial Intelligence (AI) disruption led to a bloodbath in the Information Technology (IT) stocks.
Bleeding Indian IT stocks have dampened the interest of foreign investors once again, who were returning to domestic markets after the confirmation of a trade deal between the United States (US) and India.
In addition to a significant outflow of foreign funds, expectations of higher oil prices due to tensions between the US and Iran are also weighing on the Indian Rupee. The appeal of currencies that rely heavily on imports of oil to meet their energy needs diminished in a high oil-price environment.
Meanwhile, India’s Wholesale Price Index (WPI) Inflation data for January has come in higher at 1.81% Year-on-Year (YoY) against estimates of 1.25% and 0.83% in December.
The table below shows the percentage change of Indian Rupee (INR) against listed major currencies today. Indian Rupee was the weakest against the Australian Dollar.
| USD | EUR | GBP | JPY | CAD | AUD | INR | CHF | |
|---|---|---|---|---|---|---|---|---|
| USD | 0.09% | 0.11% | 0.29% | -0.03% | -0.17% | 0.15% | 0.11% | |
| EUR | -0.09% | 0.02% | 0.22% | -0.12% | -0.26% | 0.03% | 0.02% | |
| GBP | -0.11% | -0.02% | 0.17% | -0.15% | -0.28% | 0.04% | -0.01% | |
| JPY | -0.29% | -0.22% | -0.17% | -0.33% | -0.47% | -0.18% | -0.19% | |
| CAD | 0.03% | 0.12% | 0.15% | 0.33% | -0.13% | 0.16% | 0.14% | |
| AUD | 0.17% | 0.26% | 0.28% | 0.47% | 0.13% | 0.30% | 0.27% | |
| INR | -0.15% | -0.03% | -0.04% | 0.18% | -0.16% | -0.30% | -0.01% | |
| CHF | -0.11% | -0.02% | 0.00% | 0.19% | -0.14% | -0.27% | 0.01% |
The heat map shows percentage changes of major currencies against each other. The base currency is picked from the left column, while the quote currency is picked from the top row. For example, if you pick the Indian Rupee from the left column and move along the horizontal line to the US Dollar, the percentage change displayed in the box will represent INR (base)/USD (quote).
Daily Digest Market Movers: The Fed is expected to hold interest rates steady in March and April
- The upside move in the Indian Rupee is also driven by the US Dollar’s steady performance. As of writing, the US Dollar Index (DXY), which tracks the Greenback’s value against six major currencies, trades marginally higher near 96.95.
- The US Dollar remains broadly stable at the start of the week as near-term dovish Federal Reserve (Fed) expectations have remained capped despite US inflation cooling at a faster-than-expected pace in January.
- According to the CME FedWatch tool, the possibility of the Fed leaving interest rates steady in the current range of 3.50%-3.75% remains almost unchanged after the US inflation data release.
- The data showed on Friday that the US headline inflation dropped to 2.4% YoY from 2.7% in December. Month-on-month (MoM) US headline CPI grew at a slower pace of 0.2% against estimates and the prior reading of 0.3%.
- Chicago Fed President Austan Goolsbee said to Yahoo News after the CPI data release on Friday that CPI readings are encouraging, while the service inflation remains elevated. Goolsbee argued that he wants to see further progress in inflation before supporting the restart of the monetary easing cycle.
- For more cues on the US interest rate outlook, investors will focus on the speech from Fed Governor Michelle Bowman scheduled later in the day. Fed’s Bowman has been one of the dovish policymakers in the past months.
Technical Analysis: USD/INR recovers to near 20-day EMA
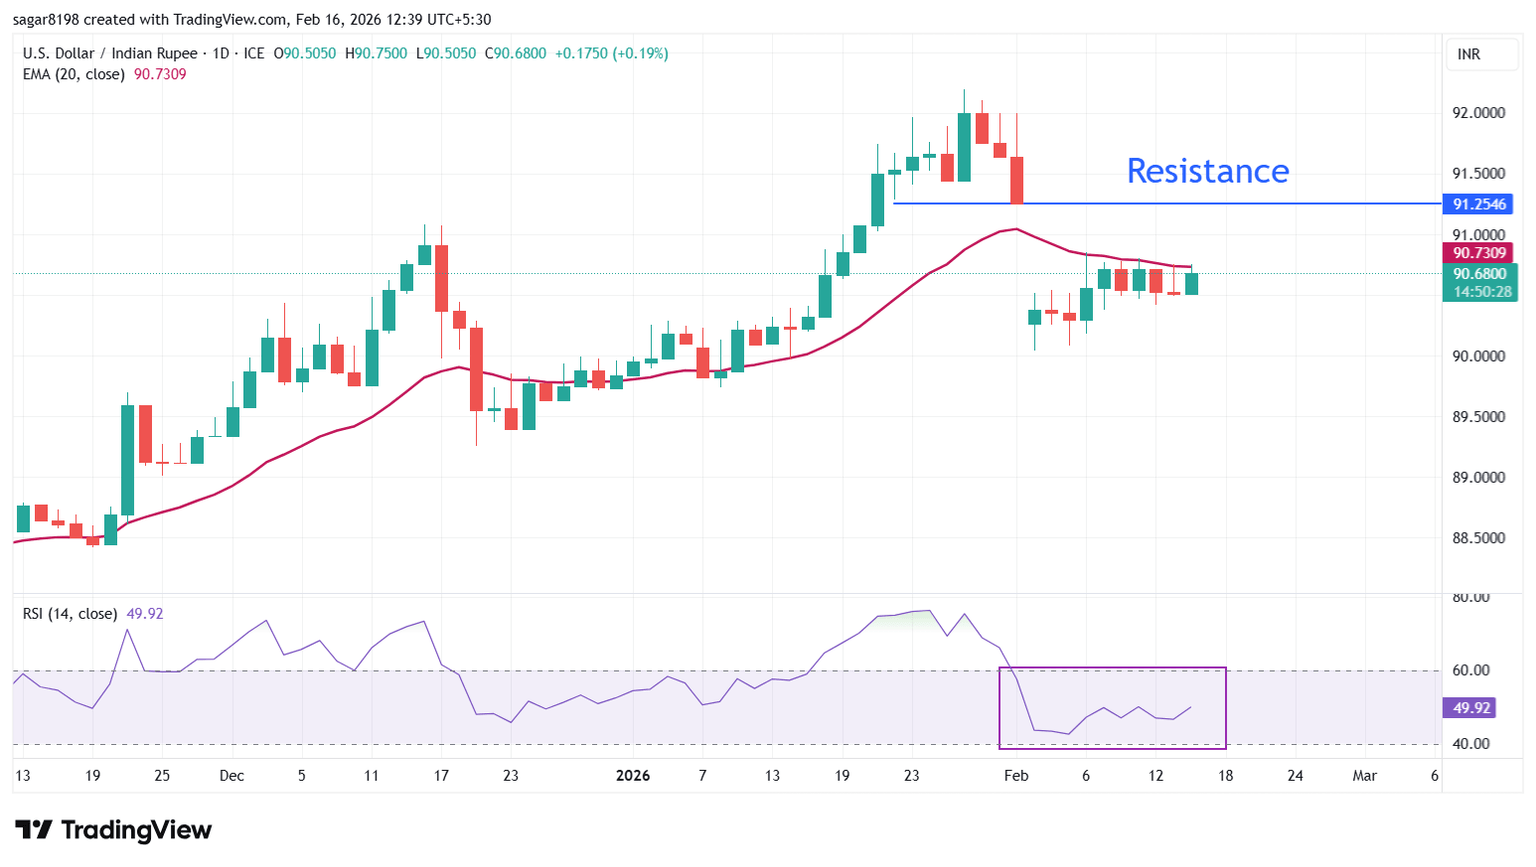
USD/INR trades higher to near 90.70 during afternoon trading hours in India on Monday. The price struggles to return above the 20-day Exponential Moving Average (EMA), which trades around 90.73.
The 14-day Relative Strength Index (RSI) wobbles inside the 40.00-60.00 range, indicating a sharp volatility contraction.
As long as the price stays below the 20-day EMA, the door for further downside towards the psychological level of 90.00 remains open. On the upside, the price could rise to the February 2 low of 91.25 once it breaks decisively above the average.
Economic Indicator
Consumer Price Index (YoY)
Inflationary or deflationary tendencies are measured by periodically summing the prices of a basket of representative goods and services and presenting the data as The Consumer Price Index (CPI). CPI data is compiled on a monthly basis and released by the US Department of Labor Statistics. The YoY reading compares the prices of goods in the reference month to the same month a year earlier.The CPI is a key indicator to measure inflation and changes in purchasing trends. Generally speaking, a high reading is seen as bullish for the US Dollar (USD), while a low reading is seen as bearish.